
- Log in to post comments
Today, our main task will be to begin the process of identifying codes and categories for our analysis of tweets. Hopefully, you have made good progress with a topic and corpus of tweets related to a hashtag. If you are still fine tuning the initial stages of collecting tweets, make sure to complete that so that you have a spreadsheet ready.
We will be undertaking three steps. You can either watch the video tutorials with steps recorded or work through the instructions below.
1.) Setting up your "corpus" and constraining or narrowing down the corpus of tweets.
The video shows that for this step, you will create the working spreadsheet you will use for your analysis. Begin by opening the TAGS sheet with the collection of tweets that you have gathered. Your number of tweets may vary depending on your topic. You may have a few hundred or thousands
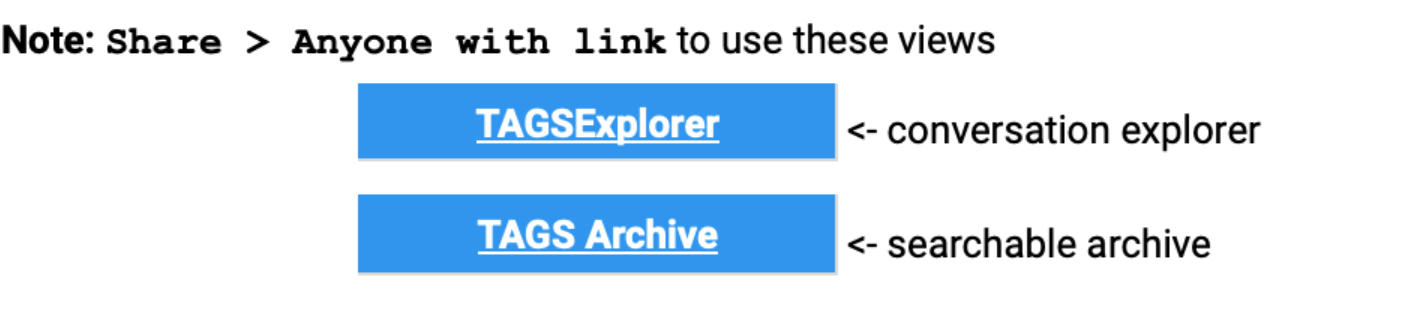
Before going further, set the Share settings to be public so that anyone can view its contents. Once you change the settings, you can try to open the links near the bottom that say TAGS Explorer and TAGS Archive. These provide some interesting tools for getting an early sense of the conversation
Next, we will begin working with our corpus of tweets. Our first step is to duplicate the worksheet so that our original data stays intact while we work with the tweets. Select the arrow next to the Archive tab at the bottom of the google sheet and choose duplicate. This will make a copy of the tweets. You can name this tab something like Working Copy. Be sure to use this duplicate for the rest of the analysis.
Next, use some filters on your spreadsheet to constrain the number of tweets.
In most cases, you will likely want to filter out retweets, and then perhaps set a time limit to narrow things down. To do so:
- Select the column with the tweets, and then from the toolbar, select the funnel icon, and then Create New Filter View; you should now have a filter available below the name of the column.
- Click on this filter icon, and then select Filter by Condition > Text Does Not Contain; In the field that opens enter RT, and then select OK. You should now have the bulk of the retweets removed.
- Next, select and copy the entire workbook in the spreadsheet (ctrl/cmd-a), and then (ctrl/cmd-c). Then use the plus icon at the bottom left to create a new workbook. In the new workbook, paste in all of the data from your filtered view. You should now have a set of original tweets (no retweets) and a much smaller number of items. (You have to copy and paste the filtered tweets into a new sheet in order to reset the row numbers to make it easier to work.) You can name this tab something like No Retweets. When finished, your spreadsheet should look something like this:
- Further constrain the tweets as needed to get a number that is about 100 tweets. You might simply narrow things down by time period. Or you could take a random sample. Choose an approach, and then delete extraneous rows in the workbook to get the final set of tweets in place.
- Finally, copy the URL of the spreadsheet, and then paste it into the comment field of this posting (below) and submit the comment.
2.) Open coding to develop a list of potential categories. For this step, you will want to follow some of the insights in our first two readings. In particular, you will want to use a grounded approach that will "let the data speak," and then you want to develop some categories and "codes" that you can use to understand the tweets.
Let's start with categories: There are two aspects of the conversation you will consider: tweets and users.
For tweets, you may want to use aspects of rhetoric to understand aspects of the conversation. Classical rhetoric uses the notion of ethos (the status/integrity of the speaker), pathos (emotions), and logos (logic) to study communication. Ethos is difficult to measure with tweets, but you can code for logic or emotions quite easily.
For tweets, you will also want to look for the type of communication. Here, it can be helpful to use gerunds or "ing" words to find codes for this category--e.g., a tweet might be informing, celebrating, or provoking.
You should also find one category that is specific to your topic. For instance if you were studying a conversation about wearing masks, you might have a stance category--position on masks: for or against. For these kinds of stance categories, you should also develop a category that considers the rationale for the stance. You might have stance on masks, and then rationale with codes like safety, personal freedom, comfort, political statement to explore why people feel the way they do about their stance.
For users, you will want categories that help you understand attitudes and positions associated with the conversation. You might have a category for political leanings. You might code for gender or age. You might also have some unique categories related to your topic. For instance, if you were looking at a conversation about Silent Sam, you might have a campus affiliation category that looked for students, faculty, administrators, etc.
Given all of this, you will come up with categories that might look something like:
- Appeal: logic, emotions
- Type of communication: informing, provoking, querying, etc.
- Stance on topic: pro, con
- Rationale behind stance: safety, political, financial, etc.
- User age: under 20, 20-30, 30-40, etc.
- User political leaning: left, right
You will want about 5-7 categories that include aspects of tweets and users.
3.) Finally, we will do additional cleanup on our clean workbook, and then add columns for our key categories. Follow these steps:
- First, remove columns that seem to be unhelpful for your analysis; some columns have duplicate information and some will not be needed. Right/ctrl-click on a column to delete it.
- Next add columns for the final categories you have identified. Place your cursor in the column with the tweet, and then from the Insert menu, select Insert Column to the Right. Repeat this process, adding and labeling all of your categories.
Once you have completed all of these steps, you can begin the process of reading the tweets, and then entering codes to populate the categories. Remember that the process should be organic, so you may need to adjust the codes you are using in the categories as you go or even add new categories. You can see the example that I have set up here.
This video guides you through the process:
To complete this task, finish the coding of all of your tweets, and then get feedback on your google sheet.